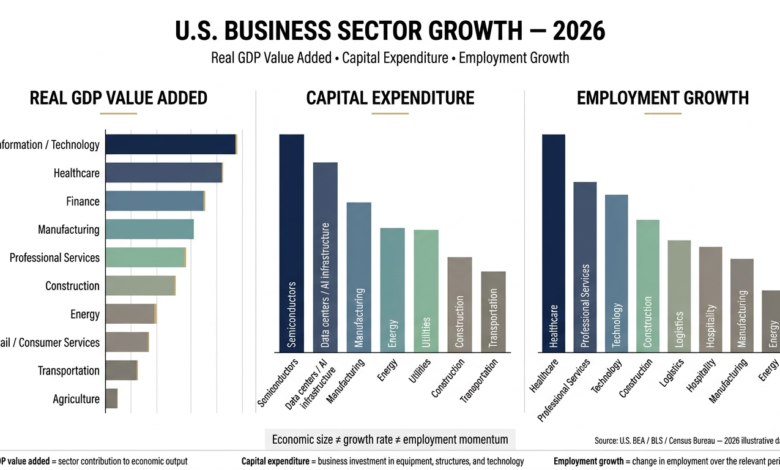
Quick Sector Comparison Table
| Rank | Sector | Main Growth Driver | Current Momentum | Employment Impact | Key Risk |
| 1 | Information Technology & AI Infrastructure | Hyperscale CapEx, enterprise cloud migration, digital security | Very High | High-wage specialized hiring; moderate total headcount | Tech CapEx overcapacity, supply constraints |
| 2 | Healthcare & Life Sciences | Demographics, chronic care demand, biotech innovation | High | Exceptional net job volume across skill levels | Reimbursement shifts, labor cost pressures |
| 3 | Semiconductors & Advanced Manufacturing | Reshoring incentives, CHIPS Act buildout, auto/AI chip demand | High | Specialized technical job growth; regional expansion | Trade restrictions, fab execution delays |
| 4 | Energy & Power Infrastructure | Grid modernization, utility scale-up, data center load expansion | High | Steady skilled trade demand; high capital intensity | Permitting bottlenecks, commodity volatility |
| 5 | Construction & Heavy Infrastructure | Manufacturing facilities, public infrastructure, utility builds | Moderate-High | High trade worker demand; labor shortages | Extended high commercial interest rates |
| 6 | Professional & Financial Services | Digital banking, wealth management, consulting, compliance | Moderate | Steady, high-value professional hiring | Credit tightening, corporate margin compression |
| 7 | Logistics, Freight & Supply Chain | E-commerce fulfillment, industrial reshoring, supply tech | Moderate | High volume; shifting toward automation | Diesel costs, consumer goods volume swings |
| 8 | Consumer Services & Leisure | Experiential spending, travel resilience, health/wellness | Moderate | Large total employment base; wage moderation | Household savings drawdown, discretionary cuts |
| 9 | Defense & Aerospace | Federal procurement, international defense posture, commercial space | High | High engineering and advanced assembly demand | Budget battles, supply-chain bottlenecks |
| 10 | Agriculture & AgTech | Automation, bio-engineered yields, export market demand | Moderate | Low net headcount; capital-intensive shift | Weather volatility, trade policy friction |
As the U.S. economy navigates the second half of 2026, macro conditions present a distinct landscape. Moderate GDP growth, steadying inflation, and a recalibrated Federal Reserve policy rate have shifted corporate priorities from short-term rapid expansion toward operational efficiency, structural capital allocation, and productivity enhancement.
While headline economic indicators suggest a steady macroeconomic baseline, performance varies widely beneath the surface. Growth is increasingly concentrated in sectors backed by long-term structural tailwinds—including AI infrastructure deployment, domestic industrial policy incentives, energy grid adaptation, and demographic demands in healthcare. Understanding which sectors lead the U.S. economy requires evaluating real value-added output, private business investment, employment creation, and long-term structural stability.
Business Sectors Leading Growth in the U.S. Economy
1. Information Technology and AI Infrastructure
Why It Is Growing
The technology sector remains an indispensable engine of U.S. economic growth. However, the nature of this growth has shifted. While consumer software and legacy enterprise IT have stabilized, exponential growth is concentrated in hyperscale data center construction, cloud computing migration, enterprise cybersecurity, and generative AI hardware deployment.
Current Economic Role
According to the U.S. Bureau of Economic Analysis (BEA), the broader Information sector (including software, data processing, publishing, and telecommunications) contributes over 5.5% directly to U.S. Real GDP, with value-added growth consistently outpacing baseline GDP expansion.
Growth Drivers
-
Enterprise AI Integration: Accelerated corporate adoption of machine learning tools to optimize operations and automate routine workflows.
-
Cloud & Data Center Expansion: Unprecedented corporate capital allocation toward specialized AI server clusters and high-density computing hubs.
-
Cybersecurity Demand: Essential non-discretionary spending by corporations and government agencies to defend expanding digital footprints.
-
SaaS Business Model Stability: Recurring enterprise software revenue providing resilient cash flows despite broader economic fluctuations.
Investment and Capital Spending
Private fixed investment in information processing equipment and software represents one of the largest single categories of non-residential corporate capital expenditure, driving double-digit annualized growth in enterprise technology budgets.
Employment Impact
While aggregate tech hiring has moderated compared to post-pandemic highs, BLS employment data indicates robust, high-wage demand for specialized roles in software engineering, cybersecurity, data science, and cloud architecture.
Five-Year Outlook
Through 2030–2031, the sector is projected to maintain high value-added growth as initial hardware investments mature into operational software applications across traditional industries.
Main Risks
-
Tech CapEx overcapacity relative to near-term monetization.
-
Power supply and cooling bottlenecks for next-generation data centers.
-
Regulatory scrutiny around AI governance, data privacy, and antitrust laws.
Bottom Line
Information Technology remains the primary driver of U.S. business investment and productivity growth, anchoring the modern digital economy.
2. Healthcare and Life Sciences
Why It Is Growing
Healthcare growth is driven by demographic realties: approximately 10,000 Americans turn 65 every day. This aging population, combined with rising chronic disease management and rapid innovations in biotechnology and medical devices, creates non-discretionary economic demand.
Current Economic Role
Healthcare and Social Assistance is one of the largest sectors by GDP value added (accounting for approximately 8% of total GDP) and serves as the single largest non-government employment sector in the United States.
Growth Drivers
-
Demographic Aging: Increasing volume of inpatient, outpatient, and specialized elder care services.
-
Pharmaceutical & Biotech Innovation: Commercialization of next-generation therapies, including GLP-1 metabolic treatments, gene therapies, and oncology innovations.
-
Outpatient & Ambulatory Care Expansion: Structural transition away from high-cost hospital stays toward specialized surgery centers and home health care.
-
Health Tech & Telehealth: Adoption of remote patient monitoring and digital administrative platforms to improve operational efficiency.
Investment and Capital Spending
Capital expenditure is focused on medical technology integration, clinical facilities, biopharmaceutical manufacturing plants, and digital health infrastructure.
Employment Impact
Bureau of Labor Statistics (BLS) data highlights Healthcare as the absolute leader in net job creation. Home health aides, nurse practitioners, medical services managers, and health technicians represent the fastest-growing occupations by volume.
Five-Year Outlook
The sector is positioned for steady expansion through 2030, insulated from broader macroeconomic downturns by persistent structural demand.
Main Risks
-
Federal and private insurance reimbursement rate pressures.
-
Severe labor shortages and elevated clinical staff compensation costs.
-
Complex regulatory approval processes for drug candidates and devices.
Bottom Line
Healthcare provides baseline economic stability, acting as the nation’s primary job engine while steadily growing its total output contribution.
3. Semiconductors and Advanced Manufacturing
Why It Is Growing
A decade of supply-chain reliance on overseas manufacturing triggered a major shift toward industrial reshoring and domestic capacity buildout. Federal legislative incentives—including the CHIPS and Science Act and Inflation Reduction Act—have channeled hundreds of billions of dollars into domestic advanced electronics and semiconductor fabrication.
Current Economic Role
While semiconductors represent a specialized segment of durable goods manufacturing, its strategic value added directly impacts automotive, defense, consumer electronics, and computing industries.
Growth Drivers
-
Federal Policy Incentives: Multibillion-dollar federal matching grants and state-level tax incentives for domestic semiconductor fabs.
-
Automotive & Industrial Electrification: Growing demand for power semiconductors, microcontrollers, and sensors in modern vehicles and automated factories.
-
Supply-Chain Resiliency: Strategic corporate efforts to mitigate geopolitical risks by establishing redundant North American manufacturing capacity.
-
AI Hardware Demand: High-volume manufacturing requirements for specialized logic chips and high-bandwidth memory units.
Investment and Capital Spending
Manufacturing construction spend has reached historic highs, with private non-residential capital investment heavily concentrated in high-tech fabrication facilities across the Sunbelt and Midwest.
Employment Impact
Creates high-wage technical roles for semiconductor process technicians, electrical engineers, plant managers, and specialized construction trades.
Five-Year Outlook
As mega-fab projects complete construction and begin commercial production through 2028–2030, value-added output from domestic advanced electronics manufacturing is expected to accelerate significantly.
Main Risks
-
Extended construction timelines and fab execution delays.
-
Shortages of specialized cleanroom technicians and electrical engineers.
-
Global semiconductor market cyclicality and trade restrictions.
Bottom Line
Advanced manufacturing is undergoing a structural domestic resurgence, supported by public policy and long-term corporate capital commitments.
4. Energy and Power Infrastructure
Why It Is Growing
The U.S. energy sector is undergoing a parallel transition: traditional hydrocarbon production remains high to meet global demand, while rapid grid modernization is underway to support power-intensive industries, electric vehicles, and hyperscale data centers.
Current Economic Role
Energy and utilities contribute significantly to U.S. industrial production, trade balance (via LNG and refined product exports), and corporate fixed investment.
Growth Drivers
-
Data Center & Industrial Power Demand: Unprecedented electricity load growth requiring utility-scale grid expansion.
-
Liquefied Natural Gas (LNG) Exports: Strong international demand positioning the U.S. as a leading global LNG exporter.
-
Grid Modernization & Storage: Private and public capital flow into high-voltage transmission, battery storage systems, and renewable integration.
-
Nuclear and Alternative Energy Expansion: Renewed commercial interest in small modular reactors (SMRs) and traditional nuclear plant life extensions.
Investment and Capital Spending
Capital expenditure in the sector is balanced between traditional oil and gas upstream production, utility-scale power generation, transmission infrastructure, and energy storage technology.
Employment Impact
Strong demand for utility workers, electrical line technicians, power plant operators, petroleum engineers, and renewable installation specialists.
Five-Year Outlook
Through 2030, power generation and grid capacity will serve as a foundational constraint or enabler for overall economic growth, guaranteeing sustained capital investment.
Main Risks
-
Permitting delays and regulatory hurdles for long-distance transmission lines.
-
Volatility in global crude oil and natural gas benchmark prices.
-
Supply-chain bottlenecks for high-voltage transformers and electrical grid equipment.
Bottom Line
Energy has evolved into a critical infrastructure bottleneck, driving significant capital spending across both traditional production and power generation.
5. Construction and Heavy Infrastructure
Why It Is Growing
Despite elevated commercial mortgage rates impacting office and retail building, overall U.S. construction activity remains resilient. This momentum is sustained by heavy industrial plant construction, data center buildouts, public infrastructure projects, and persistent single-family housing supply deficits.
Current Economic Role
Construction generates over 4% of U.S. GDP and serves as a major multiplier across industrial materials, heavy equipment, and regional labor markets.
Growth Drivers
-
Manufacturing & Data Center Facilities: Mega-project construction for semiconductor fabs, battery plants, and hyperscale computing centers.
-
Public Infrastructure Funding: Continued disbursement of federal funds under the Infrastructure Investment and Jobs Act (IIJA) for highways, bridges, water systems, and ports.
-
Residential Housing Shortage: Structural deficit in single-family housing stock supporting homebuilding activity.
-
Energy Infrastructure Projects: Construction of solar farms, wind installations, pipeline updates, and power substations.
Investment and Capital Spending
Private non-residential construction spend remains elevated, driven primarily by manufacturing and technology sector facility demands.
Employment Impact
The sector remains a primary source of high-paying jobs without requiring four-year college degrees, maintaining elevated demand for electricians, plumbers, carpenters, and project managers.
Five-Year Outlook
Infrastructure and industrial construction will provide sustained baseline momentum through 2028, while residential activity is expected to re-accelerate as mortgage rates normalize.
Main Risks
-
Persistent shortages of skilled trade labor.
-
Elevated borrowing costs for commercial real estate developers.
-
Volatility in structural building material costs (steel, cement, copper).
Bottom Line
Construction is benefiting from a structural shift toward industrial facilities, public infrastructure, and data infrastructure.
6. Professional, Financial, and Business Services
Why It Is Growing
The U.S. professional services sector—encompassing legal, accounting, management consulting, digital banking, asset management, and corporate strategy—remains a core engine of higher-wage value creation.
Current Economic Role
Professional, Scientific, and Technical Services alongside Financial Activities collectively generate over 20% of total U.S. GDP value added, forming the structural foundation of the service economy.
Growth Drivers
-
Corporate Digital Transformation: High demand for consulting expertise in enterprise technology, cloud migration, and AI integration.
-
Asset Management & Wealth Advisory: Expansion of private equity, private credit, and wealth management services catering to aging demographics.
-
Regulatory & Tax Compliance: Navigating complex global trade rules, tax regulations, and environmental compliance frameworks.
-
Fintech & Payment Digitization: Continuous consumer and business adoption of embedded digital payment solutions.
Investment and Capital Spending
Capital expenditure is primarily concentrated in software, proprietary financial technologies, data analytics tools, and AI implementation platforms.
Employment Impact
Consistently adds high-wage white-collar jobs across urban and suburban markets, with strong demand for financial analysts, corporate attorneys, technology consultants, and accountants.
Five-Year Outlook
The sector is projected to maintain strong output growth through 2030, with margin expansion supported by internal adoption of AI-driven administrative tools.
Main Risks
-
Corporate spending cuts on discretionary management consulting.
-
Credit risk in commercial real estate loan portfolios held by regional financial institutions.
-
Automation of entry-level analytical and administrative tasks.
Bottom Line
Professional and financial services provide essential expertise and capital allocation mechanisms that power broader corporate growth.
7. Logistics, Freight, and Supply Chain Technology
Why It Is Growing
Modern trade requires fast, transparent, and resilient supply chains. The expansion of e-commerce, combined with industrial reshoring, has transformed warehousing, logistics, and freight transport into a high-tech service sector.
Current Economic Role
Transportation and Warehousing contributes roughly 3.2% to U.S. GDP and serves as a primary logistical indicator for consumer goods demand and industrial output.
Growth Drivers
-
E-Commerce & Last-Mile Delivery: Steady consumer shift toward online purchasing, requiring localized distribution networks.
-
Supply-Chain Automation: Adoption of automated storage and retrieval systems (ASRS), robotics, and AI-driven route optimization in warehouses.
-
Industrial Reshoring Logistics: Restructuring domestic freight corridors to support new manufacturing plants in the Southeast and Midwest.
-
Cold Chain & Specialized Logistics: Growing demand for temperature-controlled transport for pharmaceuticals and fresh foods.
Investment and Capital Spending
Heavy capital investment in automated fulfillment hubs, electric fleet vehicles, freight management software, and port intermodal upgrades.
Employment Impact
Large overall employment footprint spanning truck drivers, logistics coordinators, warehouse operations managers, and supply-chain software specialists.
Five-Year Outlook
Continued steady growth through 2030 as logistics providers integrate automated technologies to protect operating margins.
Main Risks
-
Diesel fuel price spikes and broader energy input inflation.
-
Cyclical swings in spot freight rates and overcapacity in trucking.
-
Labor negotiations at major ports and freight rail networks.
Bottom Line
Logistics is transitioning from a traditional labor-heavy industry into a technology-driven infrastructure sector.
8. Consumer Services, Travel, and Experiential Economy
Why It Is Growing
Despite inflationary pressures over recent years, American household spending on services—including dining out, live entertainment, leisure travel, and personal care—has shown remarkable resilience, driven by a tight labor market and steady real wage gains.
Current Economic Role
Personal Consumption Expenditures (PCE) represent nearly 70% of total U.S. GDP, with consumer services accounting for the vast majority of that total output.
Growth Drivers
-
Shift toward Experiential Spending: Consumers prioritizing travel, experiences, and wellness over physical goods accumulation.
-
Real Wage Growth: Low unemployment and real income gains supporting discretionary service budgets.
-
International & Business Travel Recovery: Steady volume in commercial aviation, hotel occupancy, and conference hosting.
-
Food Service Innovation: Fast-casual restaurant expansion and digital ordering integration.
Investment and Capital Spending
Capital spending focuses on hotel renovations, airport terminal expansions, restaurant technology deployment, and entertainment venue modernizations.
Employment Impact
Represents one of the largest employers of entry-level and service personnel nationwide, contributing significantly to baseline payroll numbers.
Five-Year Outlook
Growth is expected to tracking closely with baseline real GDP and household real income expansion through 2030.
Main Risks
-
Depletion of excess household savings and rising credit card balances.
-
Margin compression from elevated labor and food input costs.
-
Sensitivity to broader macroeconomic consumer sentiment shifts.
Bottom Line
Consumer services provide essential baseline support to the U.S. economy, sustained by real wage stability.
9. Defense, Aerospace, and Commercial Space
Why It Is Growing
Elevated geopolitical tensions worldwide have led to increased U.S. national defense procurement budgets and expanded foreign military sales. Simultaneously, commercial aviation demand remains healthy and the private space sector continues its commercial expansion.
Current Economic Role
Defense and aerospace manufacturing generates valuable high-tech exports, supports advanced industrial supply chains, and funds significant domestic research and development (R&D).
Growth Drivers
-
Federal Defense Appropriations: Sustained congressional funding for military modernization, air defense systems, and naval fleets.
-
Commercial Aviation Fleet Renewal: Global airline demand for fuel-efficient narrowbody and widebody passenger aircraft.
-
Space Economy Expansion: Commercial satellite network deployments, payload launch services, and defense space systems.
-
Export Market Demand: Rising defense procurement commitments from allied nations across Europe and the Indo-Pacific.
Investment and Capital Spending
Substantial R&D investments in hypersonic technology, autonomous systems, advanced composite materials, and satellite manufacturing facilities.
Employment Impact
Employs highly specialized workforces, creating demand for aerospace engineers, systems analysts, skilled machinists, and avionics technicians.
Five-Year Outlook
Solid order backlogs across prime defense contractors and commercial aircraft manufacturers ensure visible revenue streams through 2030.
Main Risks
-
Congressional budget impasses and defense spending caps.
-
Complex supply-chain bottlenecks for specialized aerospace components and titanium.
-
Manufacturing quality control and delivery delays.
Bottom Line
Defense and aerospace provides stable, policy-backed industrial production and high-value export capacity.
10. Agriculture, Food Processing, and AgTech
Why It Is Growing
U.S. agriculture continues to leverage automation, precision farming technology, and biotechnology to optimize crop yields and meet both domestic food security and international trade demand.
Current Economic Role
Agriculture, food processing, and related bio-industries contribute approximately 5% to U.S. GDP and play a key role in the nation’s net trade balance.
Growth Drivers
-
Precision AgTech Adoption: Utilization of satellite imaging, autonomous tractors, and IoT soil sensors to lower input costs.
-
Value-Added Food Processing: Expanding domestic production of processed foods, plant-based proteins, and specialized nutritional products.
-
Global Agricultural Exports: Sustained international demand for U.S. corn, soybeans, meat products, and specialized crops.
-
Biofuels & Renewable Energy Inputs: Demand for agricultural feedstocks for renewable diesel and sustainable aviation fuel (SAF).
Investment and Capital Spending
Capital spending centers on heavy agricultural machinery, automated food processing facility construction, and biotechnological seed research.
Employment Impact
Direct agricultural production headcount remains low due to high mechanical efficiency, but food processing and AgTech software sectors maintain steady hiring.
Five-Year Outlook
AgTech integration will drive steady margin improvements and yield gains through 2030, though top-line revenue will remain subject to global commodity price cycles.
Main Risks
-
Extreme weather events and localized drought conditions.
-
International trade policy disputes and retaliatory tariffs.
-
Fluctuations in fertilizer, fuel, and crop protection input costs.
Bottom Line
Agriculture is a highly efficient, technology-driven export sector that underpins global food and energy supply chains.
The Biggest Sector Is Not Always the Fastest-Growing Sector
When analyzing economic health, it is critical to distinguish between a sector’s total size (absolute economic contribution) and its growth rate (percentage change over time).
Size vs. Growth Disconnect
-------------------------------------------------------------------------------
Large, Slow-Growing Sectors          │ Small, High-Growth Sectors
• Real Estate & Rental Leasing       │ • Specialized AI Semiconductor Fabs
• State & Local Government           │ • Battery Energy Storage Systems
• Traditional Retail Trade           │ • AgTech & Biotechnology Startups
-------------------------------------------------------------------------------
High Total Value Added ($)           │ Rapid Percentage Expansion (%)
High Baseline GDP Share              │ High Capital Expenditure Velocity
-------------------------------------------------------------------------------
For instance, Real Estate, Rental, and Leasing represents the single largest broad sector by total BEA value added (accounting for roughly 12–13% of GDP). However, due to its massive base and sensitivity to interest rates, its annual growth rate typically hovers in the modest 1% to 2% range.
Conversely, Semiconductor Equipment Manufacturing or Utility-Scale Battery Storage are smaller in absolute dollar terms relative to total GDP, but can register real annualized growth rates exceeding 15% to 20% due to surging private investment.
A smaller, fast-growing sector often serves as a key catalyst—for example, a dollar invested in data center power infrastructure generates downstream growth in construction, electrical equipment manufacturing, and technology services.
Which Business Sectors Are Creating the Most Jobs?
Economic output (GDP value added) does not automatically correlate with domestic employment growth. Capital-intensive sectors like semiconductor manufacturing generate high output per worker but employ relatively fewer total people. Service-oriented sectors drive net payroll expansion across the country.
According to long-term projections and monthly employment situation reports from the U.S. Bureau of Labor Statistics (BLS):
Top Sectors by Net Job Creation (BLS Projections Context)
========================================================================================
1. Healthcare & Social Assistance  --> Projected ~45-50% of all net new U.S. jobs
2. Professional & Technical        --> High growth in software, management, & engineering
3. Construction & Trades           --> Industrial facilities, grid infrastructure, & housing
4. Leisure & Hospitality           --> Steady demand in dining and travel accommodation
========================================================================================
-
Healthcare & Social Assistance: Consistently adds the largest net volume of positions. Occupations such as nurse practitioners, home health aides, health services managers, and physical therapists show projected 10-year growth rates ranging from 15% to over 30%.
-
Professional, Scientific, and Technical Services: Ranks second in net high-wage job creation, driven by computer systems design, management consulting, and scientific R&D.
-
Construction: Continues to report elevated job openings for skilled trade workers, outstripping the available labor supply despite high interest rate environments.
Which Sectors Are Driving U.S. Productivity Growth?
Labor productivity—measured as real economic output per hour worked—is the fundamental determinant of long-term real wage growth and living standards.
U.S. Labor Productivity Drivers (Output per Hour)
-------------------------------------------------------------------------------------
High Productivity Sectors            │ Productivity Lag Sectors
• Information Technology & Software  │ • In-Person Personal Care & Healthcare
• Semiconductor Manufacturing        │ • Traditional Hospitality & Food Service
• Automated Logistics & Warehousing  │ • Government Administration & Public Sector
-------------------------------------------------------------------------------------
High Capital Intensity per Worker    │ High Labor-to-Capital Ratio
High Technology Adoption             │ Service-Heavy Operational Model
-------------------------------------------------------------------------------------
-
Information Technology & Telecommunications: Leads national productivity expansion through continuous software development, cloud infrastructure efficiencies, and automated data processing.
-
Advanced Manufacturing: Automation, robotics, and computer-integrated manufacturing allow modern facilities to produce significantly higher output per labor hour compared to legacy industrial plants.
-
Logistics & Distribution: Warehouse automation systems and automated inventory tracking have boosted throughput per worker hour across distribution networks.
Conversely, sectors like healthcare, education, and personal consumer services experience lower productivity gains due to their inherent reliance on human care delivery.
AI as a Cross-Industry Growth Engine
It is essential to distinguish between AI as a standalone business sector (chip designers, software model developers, cloud hyperscalers) and AI as a general-purpose productivity technology adopted across the broader economy.
AI Impact Spectrum
========================================================================================
STANDALONE SECTOR (Core Hardware & Software)
• Semiconductor Fabs (NVIDIA, TSMC, Intel)
• Cloud Hyperscalers (Microsoft Azure, AWS, Google Cloud)
• AI Model Developers (OpenAI, Anthropic)

CROSS-INDUSTRY ADOPTION (Operational Productivity)
• Healthcare     --> Diagnostic imaging analysis, automated administrative coding
• Finance        --> Automated fraud detection, algorithmic risk modeling, customer bots
• Logistics      --> Dynamic route optimization, automated warehouse inventory sorting
• Manufacturing  --> Predictive maintenance algorithms, automated quality inspection
========================================================================================
While core AI hardware sales drive immediate earnings for technology vendors, the long-term macroeconomic value of artificial intelligence lies in its cross-industry adoption. Over time, as non-tech sectors integrate AI tools to automate routine tasks, overall national productivity is expected to accelerate, creating economic value across the wider market.
Where U.S. Economic Growth Is Concentrated
U.S. economic growth is geographically uneven, driven by regional industry clustering, state tax policies, energy resources, and labor migration patterns.
Regional Growth Hotspots
--------------------------------------------------------------------------------------
The Southeast (Sunbelt Corridor)     │ • Georgia, North Carolina, Florida, Tennessee
                                     │ • Strengths: EV plants, logistics, financial services
--------------------------------------------------------------------------------------
Texas & Central Gulf                 │ • Austin, Houston, Dallas-Fort Worth
                                     │ • Strengths: Tech, oil & gas, LNG exports, corporate HQ
--------------------------------------------------------------------------------------
The Midwest Industrial Belt          │ • Ohio, Indiana, Michigan
                                     │ • Strengths: Semiconductor fabs, battery plants, AgTech
--------------------------------------------------------------------------------------
Mountain West Tech Hubs              │ • Arizona, Utah, Colorado
                                     │ • Strengths: Semiconductor manufacturing, aerospace, software
--------------------------------------------------------------------------------------
-
The Southeast: States like Georgia, North Carolina, and Florida lead in net population inflows, attracting major capital investments in automotive EV facilities, financial services hubs, and logistics infrastructure.
-
Texas: Austin, Houston, and Dallas-Fort Worth serve as dual engines for traditional energy, clean tech, semiconductor production, and enterprise software relocations.
-
The Midwest: Benefiting from a manufacturing renaissance, with significant private investment flowing into semiconductor fabs (Ohio) and electric vehicle battery facilities (Michigan, Indiana).
-
The Mountain West: Arizona and Utah continue to grow as high-tech hardware hubs, leveraging proximity to West Coast capital with competitive operating costs.
How These Trends Affect Small Businesses
While headline sector trends are often dominated by large public corporations, these macroeconomic shifts create direct opportunities and challenges for small and medium-sized enterprises (SMEs):
-
Supply-Chain Integration: Small precision machine shops, localized electrical contractors, and specialized logistics providers benefit directly from large-scale manufacturing and data center construction projects.
-
Technology Accessibility: Affordable cloud computing and SaaS tools allow small businesses to adopt enterprise-grade marketing, accounting, and operational software at low upfront costs.
-
Labor Cost Pressures: Elevated baseline wages in growing sectors (like healthcare and construction) force small business owners to offer competitive compensation to retain skilled workers.
-
Capital Cost Constraints: Higher prevailing interest rates make traditional bank credit and equipment financing more expensive for small firms seeking expansion capital.
How Interest Rates Could Change the Growth Picture
Federal Reserve monetary policy exerts a direct, uneven influence across economic sectors depending on their capital intensity and leverage reliance:
Interest Rate Sensitivity Matrix
---------------------------------------------------------------------------------------
High Interest Rate Sensitivity        │ Low Interest Rate Sensitivity
(Capital-Intensive / Leveraged)       │ (Non-Discretionary / High Margin)
--------------------------------------│------------------------------------------------
• Commercial Real Estate & Residential│ • Healthcare & Pharmaceuticals
• Capital Equipment Manufacturing     │ • Enterprise Software & SaaS
• Automotive & Transportation         │ • Defense & Public Procurement
• High-Yield Debt Regional Banking    │ • Energy & Utilities (Pass-Through Rates)
---------------------------------------------------------------------------------------
-
Capital-Intensive Sectors: Construction, residential real estate, automotive manufacturing, and capital equipment are directly slowed by elevated borrowing costs due to high financing needs.
-
Asset-Light & Non-Discretionary Sectors: Enterprise software, healthcare, defense, and specialized consumer services remain less sensitive to interest rate fluctuations, allowing them to sustain growth throughout tight monetary cycles.
Government Policies Supporting Growth
Current economic growth across several key sectors is supported by federal legislation enacted in recent years:
-
CHIPS and Science Act: Direct federal grants, research subsidies, and tax credits driving hundreds of billions in private semiconductor manufacturing investment.
-
Inflation Reduction Act (IRA): Tax credits supporting utility-scale solar, wind, nuclear, battery manufacturing, carbon capture, and clean hydrogen production.
-
Infrastructure Investment and Jobs Act (IIJA): Multi-year federal funding dedicated to highways, bridges, public transit, port modernization, clean water infrastructure, and rural broadband expansion.
-
National Defense Authorization Act (NDAA): Annual legislative appropriations providing long-term funding stability for defense contractors and aerospace technology R&D.
Which U.S. Sectors Could Lead Growth Through 2030?
Projecting macroeconomic performance through the end of the decade involves evaluating long-term demographic, technological, and strategic trends.
Top 5 Growth Sectors Projected Through 2030 (Forecast)
========================================================================================
1. Information Technology & AI Infrastructure --> Computing demands continue scaling
2. Healthcare Services & Biotechnology         --> Aging demographics guarantee demand
3. Energy, Power Generation & Grid Infrastructure --> Crucial bottleneck for industrial expansion
4. Advanced Electronics & Semiconductors        --> Domestic fabs complete construction & scale
5. Industrial Automation & Supply-Chain Tech   --> Re-shoring requires labor automation
========================================================================================
-
Information Technology & AI Infrastructure: Hardware deployment will transition into broad enterprise software utilization, driving sustained tech sector value added.
-
Healthcare & Life Sciences: Demographic trends ensure non-discretionary spending and steady job creation through 2030 and beyond.
-
Energy & Power Infrastructure: Power generation constraints will require sustained capital expenditure across traditional, nuclear, and renewable infrastructure.
-
Semiconductors & Advanced Electronics: Newly constructed domestic fabrication plants will begin commercial output, capturing global market share.
-
Industrial Automation & Robotics: Higher labor costs will incentivize continuous corporate spending on factory and warehouse automation.
What Could Slow These Growth Sectors?
While leading sectors possess strong momentum, several macroeconomic risks could dampen expansion:
-
Persistent Power Constraints: Inability to build electrical transmission lines and power generation fast enough to support data centers and advanced manufacturing plants.
-
Skilled Labor Deficits: Structural shortages of specialized workers—including cleanroom technicians, electricians, nurses, and cybersecurity engineers.
-
Geopolitical & Trade Friction: Export controls, retaliatory tariffs, or maritime trade disruptions escalating international supply-chain costs.
-
Extended High Borrowing Costs: Prolonged elevated interest rates dampening corporate fixed investment and commercial construction.
-
Regulatory & Antitrust Friction: Increased regulatory intervention around big tech mergers, AI development, or biopharmaceutical pricing models.
Sector Leaders by Category
Based on verified macroeconomic data from the BEA, BLS, and Federal Reserve:
-
Largest Total Economic Contribution (GDP Share): Real Estate, Rental, & Leasing (Broad Industry) / Professional & Financial Services (Combined Service Sector).
-
Fastest Real Value-Added Growth Rate: Information Technology & Data Infrastructure.
-
Strongest Net Job Creation Engine: Healthcare and Social Assistance.
-
Strongest Capital Expenditure Momentum: Semiconductor Fabrication & Utility-Scale Power Generation.
-
Highest Labor Productivity Potential: Advanced Technology & Industrial Automation.
-
Best Long-Term Structural Outlook (Through 2030): Healthcare & Power/Grid Infrastructure.
Three Scenarios for the U.S. Economy
Macroeconomic Scenario Framework
---------------------------------------------------------------------------------------------------------
Scenario         │ Macro Environment                  │ Leading Sectors
-----------------│------------------------------------│--------------------------------------------------
1. Base Case     │ • Moderate GDP growth (1.8%-2.2%)  │ • IT / AI Infrastructure
                 │ • Inflation trends near target     │ • Healthcare & Life Sciences
                 │ • Stable rate environment          │ • Power & Grid Infrastructure
-----------------│------------------------------------│--------------------------------------------------
2. Upside Case   │ • Accelerated productivity gains  │ • Advanced Manufacturing
                 │ • Broad AI integration          │ • Construction & Capital Goods
                 │ • Lower capital costs              │ • Enterprise Software & Tech
-----------------│------------------------------------│--------------------------------------------------
3. Downside Case │ • Persistent sticky inflation      │ • Non-Discretionary Healthcare
                 │ • Geopolitical supply shocks       │ • Defense & Security Procurement
                 │ • Prolonged high interest rates    │ • Consumer Essentials
---------------------------------------------------------------------------------------------------------
FAQ
Which industries are driving U.S. economic growth?
U.S. economic growth is led by Information Technology (specifically cloud computing and AI infrastructure), Healthcare, Advanced Manufacturing (semiconductors), Energy/Power Infrastructure, and Construction.
What is the fastest-growing industry in the United States?
In percentage terms of real value-added growth, high-tech sectors—including specialized semiconductor equipment, data processing, and clean energy generation—are among the fastest-growing. In terms of job volume, home healthcare and medical management lead.
Which sectors are creating the most jobs?
Healthcare and Social Assistance adds more net jobs than any other single broad sector, followed by Professional, Scientific, and Technical Services, and Construction.
Is AI one of the biggest U.S. growth sectors?
AI-related hardware, cloud infrastructure, and chip manufacturing represent one of the fastest-growing categories of corporate capital spending. However, the broader macroeconomic impact of AI comes from its adoption as a productivity tool across traditional industries like finance, healthcare, and logistics.
Which industries are attracting the most investment?
Semiconductor manufacturing, hyperscale data centers, utility power infrastructure, and renewable energy storage are attracting high levels of private fixed capital expenditure.
What industries could lead U.S. growth through 2030?
Information Technology, Healthcare, Energy Infrastructure, Advanced Electronics, and Industrial Automation are positioned to lead U.S. economic expansion through 2030 due to strong demographic and technological tailwinds.
How do interest rates affect growing sectors?
High interest rates slow capital-intensive sectors like commercial construction and real estate, while asset-light sectors like enterprise software and non-discretionary healthcare remain more resilient.
Which industries are most vulnerable to an economic slowdown?
Highly discretionary consumer services, commercial real estate development, cyclical freight transportation, and low-margin traditional retail are typically most vulnerable to economic deceleration.
The U.S. economy in 2026 exhibits a clear divide: while traditional consumer goods and debt-sensitive real estate adapt to post-inflationary conditions, sectors tied to structural megatrends—technology infrastructure, healthcare, energy adaptation, and domestic advanced manufacturing—are expanding steadily.
Evaluating business sector leadership requires looking beyond short-term stock performance or total industry size. By examining real output value added, private capital investment, net employment impact, and productivity growth, business leaders and economic observers can identify the industries driving sustained growth across the U.S. economy.